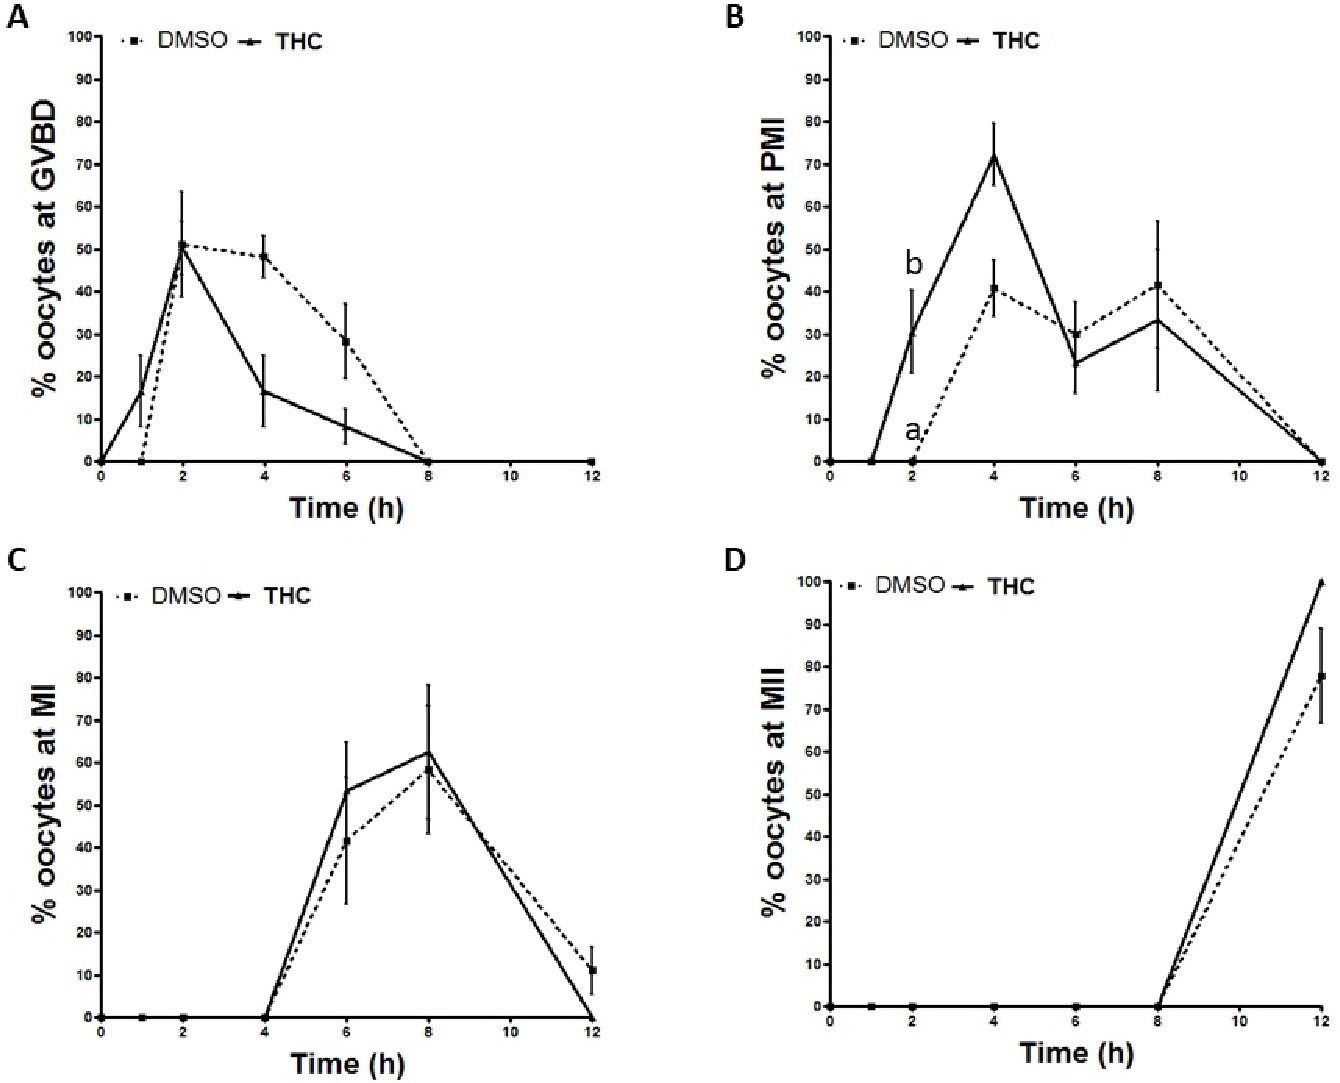
Fig. 3. Changes in nuclear maturation of oocytes. Results are expressed as percentage of oocytes at each stage of maturation at each point: (A) germinal vesicle break down, GVBD; (B) pro-metaphase I stage, PMI; (C) metaphase I stage, MI; (D) metaphase II stage, MII. n = 5 independent experiments of 15 oocytes per treatment. Significant differences between treatments are indicated with different letters; p<0.05 in all cases.